2013/11/05
2011/03/16
 |
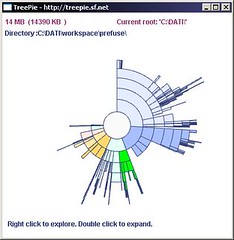
| treepie release 1.4 (hard disk usage tool) |
This a free software and open source, code inside the zip.
A nice book about the visualization of complex networks :
Visual Complexity
And a general article about sunburst diagram
Una nuova versione di TREEPIE! :D
https://sourceforge.net/projects/treepie/files/treepie/TREEPIE_1.4.zip/download
2011/02/28
2010/10/04
I've used TreePie on several machines and found one that does not work very well.
When I use it to visualize the C: drive on my new Windows 7 computer, x86-64 edition, (230 GB drive, with 150 GB free space), it creates a pretty confused result. Most of the folders display red, and the name of the folders when you hover over changes, but not in any correlation with the displayed pie chart. The sizes are also all over the map.
TreePie 1.2 has no problem with the C: drive. Also, TreePie 1.3 works fine on my old Windows XP machine, and on a smaller subset of the C: drive on the Win7/64 machine.

Look quite wrong. I hope to fix this soon
2009/07/18
2009/07/08

2009/06/10

2009/05/10
   1 F5 to rescan directory
   2 compatible with vista (now junction folder are ignored)
   3 small color change
After the release treepie will be split in 2 branch of development "main" and "experimental" and 2 developers will start to work on experimental branch to check new idea. :D
Marco
2009/03/25
2008/06/05
Sembra scritto pensando a http://weshowthemoney.com/italiaAMMINISTRATORI IN CONDOMINIO *
di Carlo Drago , Andrea Polo e Paolo Santella 06.12.2007Nel periodo 1998-2006 la grande maggioranza delle società quotate italiane è stata collegata in un'unica rete attraverso una piccola minoranza di amministratori. Un gruppo, questo, che mostra grande stabilità nel tempo e con componenti che spesso appartengono alle stesse famiglie. Assai alto il grado di connettività per le blue chips e in particolare per quasi tutte le principali società bancarie e finanziarie. Negli ultimi anni tende a ridursi il numero dei collegamenti, ma non delle società coinvolte, con una maggiore centralità di Mediobanca. E la concorrenza?
2008/05/11
A review of TREEPIE:
[..]But now there's a new contender called TreePie [4]. Basically, TreePie represents disk usage like a pizza with the size of each slice representing the space taken by each top level folder. Clicking a folder "slice" will then display a similar "pizza" breakdown of the sub-folders and files in that folder. It sounds complicated when I describe it but it's simple and intuitive in use.
It's also highly effective. Add to that the fact that it's also portable, has an alternative Windows explorer view and is free open source software and you have an easy "top product in class" recommendation.
My only complaint is its rather slow scan time. Still, this is not the kind of program you will be using everyday so a short delay is quite tolerable
http://46best.com/dr/best-free-disk-space-analyzer.htm
2008/05/09
2008/03/28

2008/02/27

8aweek.com is a fantastic tool to understand the use ( ehm the waste ) of your time online.
They have also a blog: http://8aweek.com/blog/ well written and funny too.
UPDATE 23/03/20: DEAD! :(
2007/12/27
UnfluenceBlog: "Sister project
November 26th, 2007
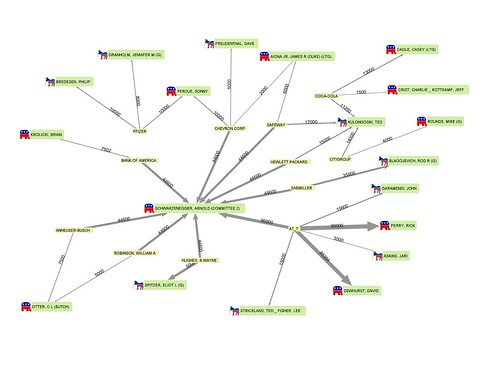
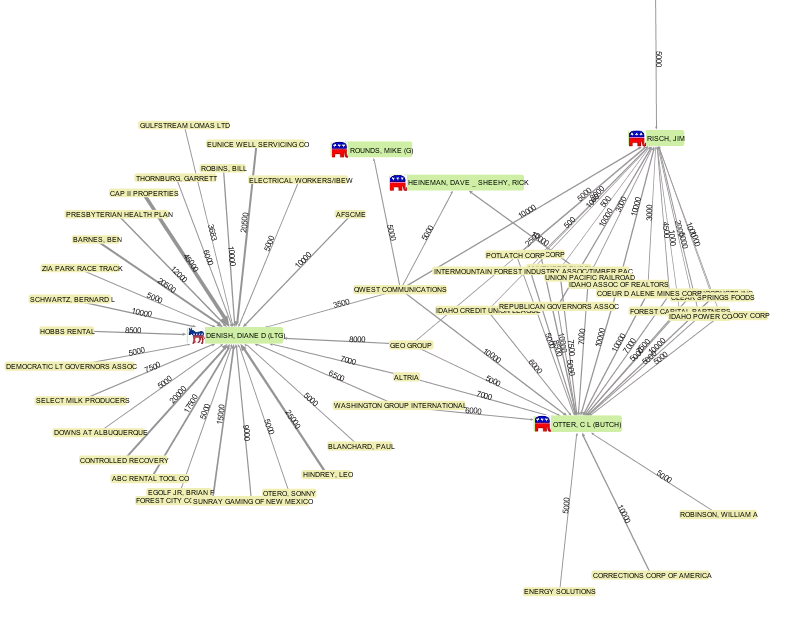
Great minds think alike. Marco Borgna just contacted us to tell us about a nice Java/prefuse application he built to show networks of contributions to US governors races using NIMSP data. Check it out at http://weshowthemoney.com/
A nice feature is that it is shows data combined for multiple states, so you can get a picture of the activity of unions and PACs at the national level.
Are there any similar projects showing EU data?"
Unfluence is a great project of visualization !
2007/10/02
UPDATE 9.28 25/11/2007: first version application online. send comments ( and report bug bug@weshowthemoney.com )! :D
My friend Daniele Galiffa from Mentegrafica.it has pointed me to the data coming from Follow The Money a nonpartisan organization dedicated to documentation and research on campaign finance at the state level.
I have used for now only data about Governors elected in 2006 and used they top 100 donors.
Images here and in my photo blog are the results of my first attempt to show the data using the prefuse visualization library
I will release the applet to produce the images when ready :D .
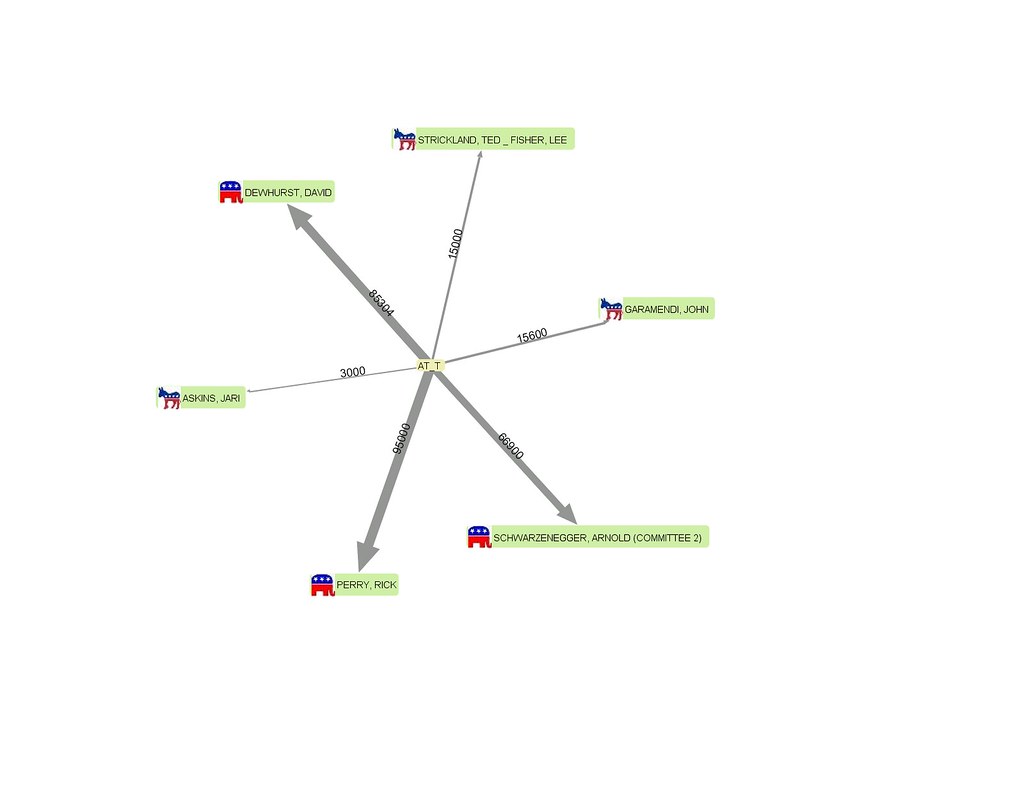
Italian follows :)
Qui potete vedere cosa si può fare in America con i soldi.
Qui potete vedere che cosa succede tra i soldi e la politica in America.
Qui potete vedere l'America.
Abbiamo ricavato i nostri dati da Follow The Money e li abbiamo resi visibili.
Si vede l'ambiguità di chi finanzia indistintamente Repubblicani e Democratici.
Altre foto qui
2007/04/19
Solo una preview del mio software per la visualizazzione delle societa' italiane quotate
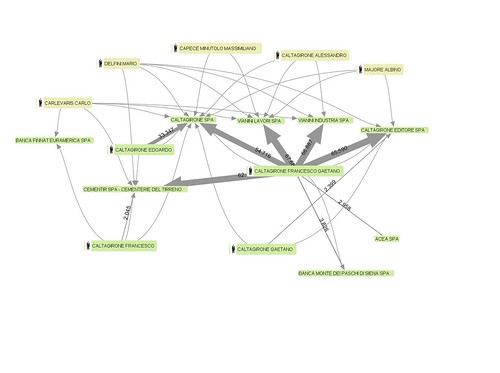
BETTER BIG
Originally uploaded by borgmarc.
2006/10/26
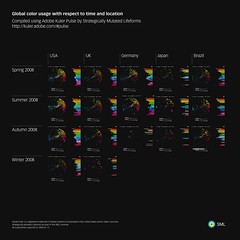
An evaluation of space-filling information visualizations
for depicting hierarchical structures JOHN STASKO
and also:
http://www.iro.umontreal.ca/~sahraouh/qaoose2005/paper3.pdf